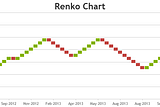
Implementing Renko Charts Using CanvasJSRenko charts, with their distinctive brick-like appearance, offer traders a cleaner view of price movements by filtering out minor…3h ago103h ago10
How to Fix CanvasJS Charts Not Redrawing After Tab InactivityModern browsers like Google Chrome include a Memory Saver feature, which helps optimize system resource usage by suspending inactive tabs…Mar 27Mar 27
Creating a Gauge Chart in CanvasJS Using a Doughnut ChartGauge charts, often resembling speedometers or dials, are excellent tools for visualizing a value within a range, such as performance…Mar 14Mar 14
Published inDev GeniusUseful Git Commands for Working with CommitsGit is a powerful version control system, and mastering it is key to working efficiently on any project. One of the most essential tasks in…Mar 114Mar 114
Customizing CanvasJS Chart Tooltips with Simple CSS TweaksCanvasJS is a charting library that allows developers to create interactive and visually appealing charts with ease. With a few CSS tweaks…Mar 7Mar 7
How to Match CanvasJS Chart Themes with Your Website’s Aesthetic and BrandingCanvasJS is a JavaScript library for creating interactive charts. While it’s known for its performance & simplicity, its true power lies…Mar 6Mar 6
CanvasJS Charts in Bootstrap Modals and TabsBootstrap elements like modals and tabs are widely used to organize content in a clean, user-friendly way. However, embedding dynamic…Mar 5Mar 5
How to Enhance Charts with Emojis for Better Visual AppealCharts are great for data, but they can sometimes look uninspiring — even with flexible libraries like CanvasJS. What if there was a…Feb 7Feb 7
CanvasJS Cheat Sheet: Quick Guide to Interactive ChartsCanvasJS is a JavaScript library for creating interactive and visually appealing charts. Whether you’re building dashboards, reports, or…Feb 5Feb 5
How to Show “No Data Available” in CanvasJS ChartsWhen creating charts with CanvasJS, there may be instances where no data is available to display. Instead of showing an empty chart, you…Jan 24Jan 24
Localization in Charts: Data Visualization for Global AudiencesLocalize data visualization with CanvasJS by customizing numbers, dates & units in English, French, and German for a global audienceJan 22Jan 22
Integrating CanvasJS and DataTables with Dynamic Data UpdatesCanvasJS and DataTables are JavaScript libraries for visualizing data in web-applications. When combined, they allow you to display tabular…Jan 13Jan 13
How to Visualize Live Data from Google Sheets Using CanvasJSVisualizing real-time data can change how decisions are made, helping businesses respond quicker and smarter. A study showed that companies…Dec 17, 2024Dec 17, 2024
Adding CanvasJS Charts to Your Figma ProjectDesigners often need to present data visually within their Figma projects. You can easily add stunning, data-driven CanvasJS charts…Nov 27, 2024Nov 27, 2024
How to Host Your Private / Custom npm Packages: A Step-by-Step GuideWhen working on a project, especially within a team or organization, there are times when you need to host your own custom npm packages…Nov 22, 2024Nov 22, 2024
The Importance of Data Sampling and Grouping in Data VisualizationIn today’s world of data-analysis and visualization, the volume of available data can be overwhelming. With the continuous growth of…Nov 18, 2024Nov 18, 2024
Visualizing Nutrition in Food using CanvasJS Pie Chart and API Ninjas Free APIWith the increasing awareness of healthy eating, understanding the nutritional content of food has become essential. Visualizing this data…Oct 10, 2024Oct 10, 2024
Redirecting Non-Existent Subdomains to HomepageRedirecting non-existent subdomains to your homepage is a great way to ensure users don’t encounter error pages and instead find themselves…Oct 1, 2024Oct 1, 2024
Integrating CanvasJS with Svelte: A Step-by-Step GuideCanvasJS is a charting library that allows developers to add interactive and responsive charts to app with ease. It can seamlessly be…Sep 30, 2024Sep 30, 2024
Fixing the Flaws: Troubleshooting CanvasJS Charting ProblemsCanvasJS is a tool for creating interactive and visually appealing JavaScript charts. Like any other tool, you can encounter set of…Sep 25, 2024Sep 25, 2024